I did some exploratory data analysis with Tableau on the Ames housing dataset from the eponymous Kaggle competition. Time to switch to R for uglier if more informative plots: I will use Added Variable Plots to get further insight on the interactions between variables in predicting the price of a house.
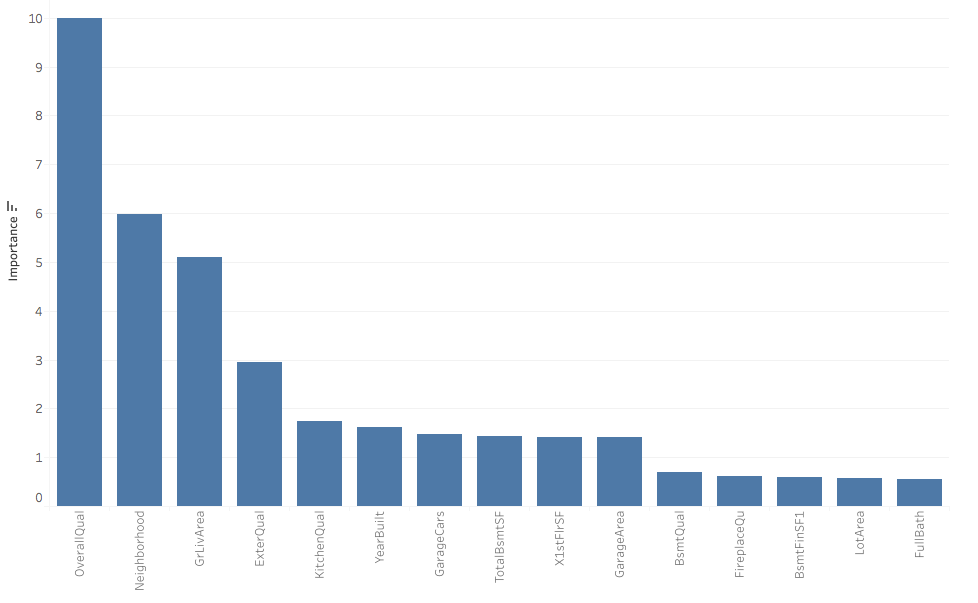
First of all I selected a handful of features to concentrate on. Instead of going by gut feeling, I used the importance score from randomForest, since I had already written a script using that function. The importance drops sharply after the 11th feature, so I stuck to the first 11, which happen to be more or less the same that I considered in the previous visualisations.
With these variables I set up a linear model in R using lm. I use the function avPlots from the car library to do some regression diagnostics on the model. Warning: ugly plots to follow.
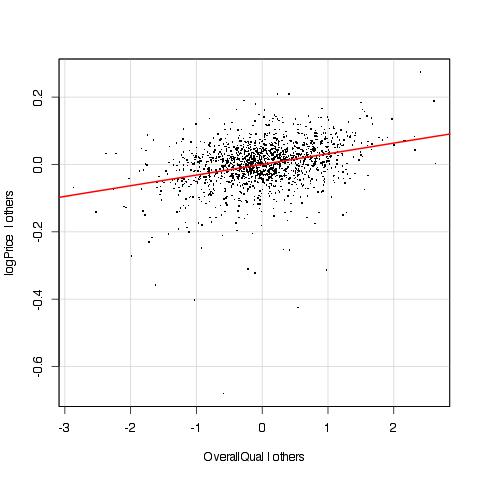
This is the added variable plot for the most important variable, the Overall Quality score. Added variable plots are a way to look at the effect of an independent variable on the dependent variable in a regression with multiple independent variables, as is our case. They are explained well here. Let’s just say that they are like looking at the regression residuals as a function of the given variable, but better, because they take into account correlations between the independent variables. Do use these plots every time you run a regression, please.
Anyway, we see that the sale price increases OverallQual, no surprises here. The relation seems linear and not overly affected by outliers. So we can move on.
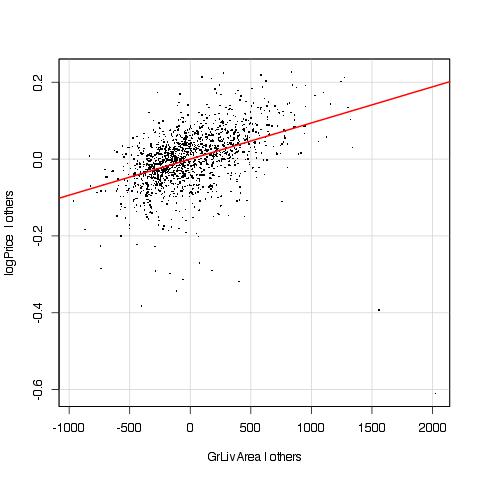
GrLivArea doesn’t look linear. There is also an ugly outlier in the lower-right corner (around (1500, -0.4)) that has lots of leverage on the regression. Let’s address the non-linearity first. I already had the feeling that a log transform would improve the situation even before seeing the plot, because of the large range in area covered by the dataset: so let’s switch to log GrLivArea.
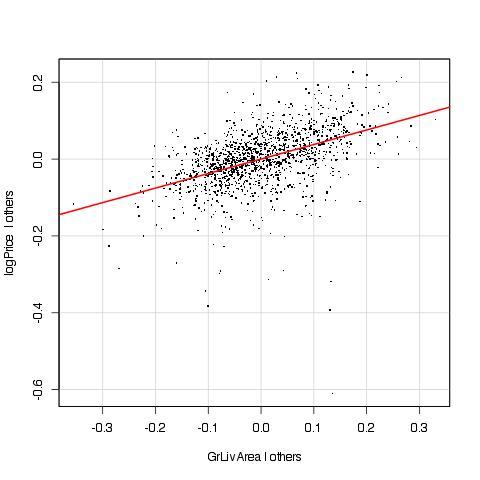
So this is the added variable plot for log GrLivArea in a new model where GrLivArea was replaced by its log. This looks so much better, and the outlier also magically disappeared. The adjusted R-square of the model also went up a little bit, from 0.849 to 0.857. Let’s move on to another feature: YearBuilt.
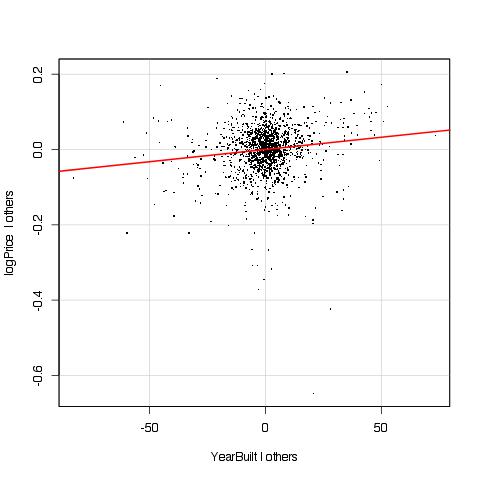
I don’t like it but I can’t put my finger on why. All the points seem concentrated near the origin, with little leverage, and the slope is set by the few points that are far to the right or to the left. Can’t blame the data for being what they are. Still, even without looking at the plot, I already planned to use the age of the building (difference between the year of the sale YrSold, and the year in which the house was built or remodeled, YearRemodAdd) instead of YearBuilt.
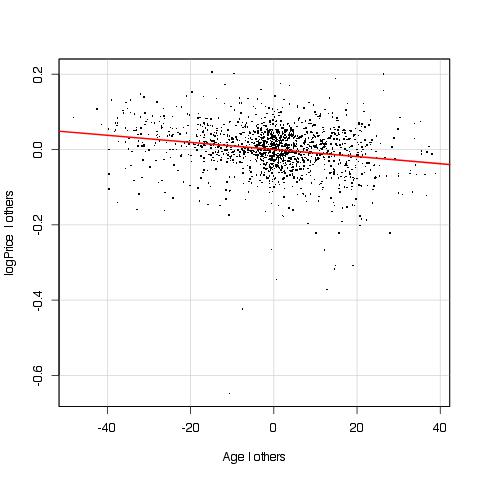
Ok, new model with Age replacing YearBuilt. This plot looks nicer even though there is a hint of nonlinearity. Maybe it’s worth a adding quadratic in Age. Anyway, before doing that, let me celebrate that the adjusted R-square went up a little bit more. Note that until now I kept the number of parameters in the model constant, by the way.
What about GarageCars? I wasn’t expecting the size of the garage in terms of cars to be so important. Let’s look at its added variable plot.
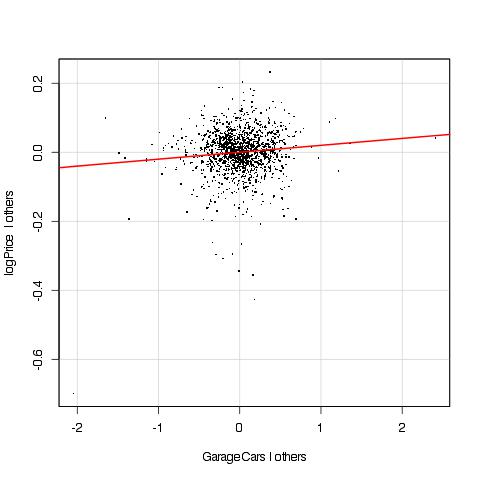
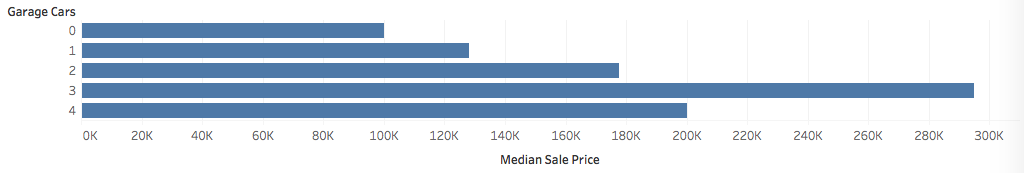
Look at that point to the extreme right and at the one on the left at around y = -0.2. Bad, bad outliers. A look at the variable GarageCars shows that it is mostly 0, 1, 2, or 3. Who needs a garage where more than three cars fit? Only five homeowners out of 1460, in this dataset. And their houses aren’t the most expensive ones, not even close.
Well, I’ll think about this. Meanwhile, based on the understanding gained so far, this script does get a slightly better leaderboard score than the previous one, where I was already making some avPlots.